Anatomy of a network test that lied
By UA Ledger staff — Archive date: 6 min read
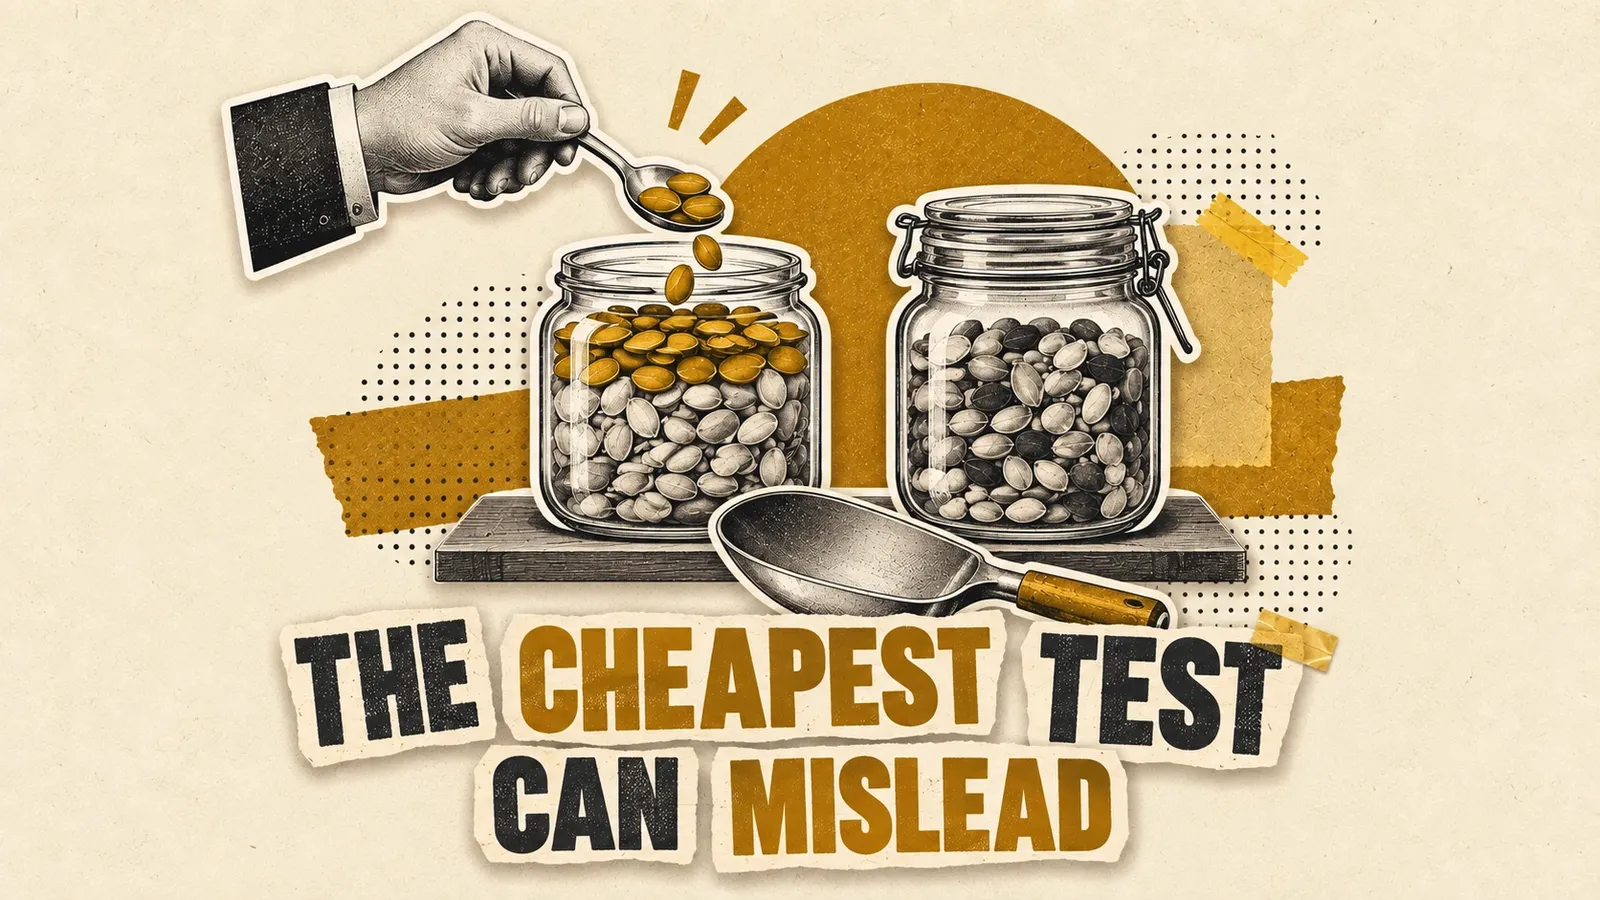
Most network tests fail because the design lets the network choose its own sample. Here is how a good-looking test misleads and what to require instead.
You test a new network for four weeks with a small budget. The reported CPI beats the blended figure, the D7 ROAS sits above target, and the account manager sends a deck. The network goes into the plan at five times the test budget. Three months later blended CPI has risen, the network's own numbers still look good, and nobody can explain where the installs went.
The test did not lie because anyone cheated. It lied because a budget-capped test on a network with a modern optimiser hands the network the power to choose its own sample. Given a small budget and an instruction to hit a CPI or ROAS target, the optimiser does the rational thing: it finds the users who were already most likely to install and serves them. Many of those users would have installed anyway, whether from another channel or from nothing at all. The test measured the network's ability to identify likely installers, which isn't the thing you're paying for. You're paying for installs that wouldn't otherwise have happened.
The sample the network picks
Every major network's optimiser now models install and post-install probability at the user level and bids most aggressively where it is highest. Users who have recently played similar games, who have searched for the genre, or who have already seen your creative elsewhere score highest. At small budgets the optimiser never has to go beyond this group. Its reported performance is the performance of the easiest cohort in the market.
Last-touch attribution then completes the illusion. When one of those high-intent users installs, the new network was very often the most recent touch, because it was bidding hardest on exactly those users. The MMP awards the install. Your existing channels lose the credit for users they helped create. Total installs barely move; the new network's dashboard fills up.
SKAN and AAK on iOS soften the problem only slightly. Aggregated postbacks still flow to the winning network, and the winner is still whoever bid hardest on users already primed to convert.
What the test should have measured
A network test has to answer three questions, and the standard design answers none of them.
Does the network add installs at all. This is an incrementality question and it needs a holdout: geo split, a ghost-ads style design where the network supports it, or a synthetic control on markets where the network is not switched on. We covered the affordable options in "Incrementality tests you can afford: geo holdouts, ghost ads, and what breaks". A network test without a holdout is a request for the network's opinion of itself.
What does the marginal install cost at the budget you intend to run. The first week's CPI is the price of skimming. Push the budget in steps until CPI starts to climb, and record the level at which it climbs. That is the network's real capacity for your title, and the average CPI up to that point is the number that belongs in the plan.
What do the network's cohorts look like at D30 compared to blended. Not D7. Optimisers trained on short-window events are very good at finding users who produce those events, and indifferent to what happens after. A cohort that matches blended at D7 and falls well below it at D30 is a cohort of users the optimiser tuned to the proxy.
The second-order effect: cannibalisation shows up elsewhere
The part of a bad network test that is hardest to see is that its cost lands on other line items. When the new network takes attribution for users your other channels were reaching, those channels' measured ROAS falls. The next optimisation round lowers their bids or cuts their budgets, because the dashboard says they got worse. The new network's share rises further, its numbers still look fine, and the blended figure drifts up with no single campaign to blame.
The consequence for the review process is that you can only judge a network test on the total account, never on the network's own reporting. If total installs and total cost in the test geo moved by less than the network's claimed contribution, the difference is cannibalisation, and it is the network's real cost.
A worked illustration
Invented numbers, for the arithmetic only. Suppose you test a network in two comparable geos, switched on in one and held out in the other. Over four weeks the network reports 4,000 installs at a 2.2 unit CPI in the test geo. Total installs in the test geo rose by 1,500 relative to the holdout, adjusted for the baseline difference between the two. Reported installs from the existing channels in the test geo fell by about 2,300.
The network's incremental CPI isn't 2.2. It's total spend divided by 1,500, which lands near 5.9. If the plan's blended target is 3.5, the network is not a buy at any scale, regardless of its dashboard. Had the test run without a holdout, the team would have scaled on a 2.2 figure, and blended CPI would have drifted upward for a quarter before anyone traced it.
Decision rules for the next test
- No holdout, no test. If a geo or synthetic control isn't possible for a network, it gets a smaller permanent allocation with a hard cap, treated as a known uncertainty rather than a measured opportunity.
- Report only incremental CPI and incremental ROAS to the budget meeting. The network's own figures are context, not evidence.
- Budget ramps are part of the test. A test that never pushed spend to the point where CPI rose has not measured capacity, and the plan should not assume any.
- D30 quality is the gate for scaling. D7 is the gate for continuing the test.
The trade-off is real: a test built this way takes eight to ten weeks rather than four and costs more in the holdout geo's forgone spend. The network's account team will push for the faster version because the faster version flatters them. Since the ironSource network closed at the end of April and demand has consolidated across fewer large buyers, the pressure to add channels quickly has risen, and so has the cost of adding the wrong one.
Keep the holdout running for a fortnight after you scale the network. The optimiser behaves differently at full budget than it did during the test, and the only way to know whether the incrementality held is to keep measuring after the decision, when the temptation to stop looking is strongest.
Related archive reading
These articles provide related context and remain subject to their stated review status.
Featured
Related posts
measurement
media buying
·1 min read
Using predicted LTV in bids: disclosure checklist for the UA team
measurement
media buying
·1 min read
Blended ROAS targets that hide channel failure in F2P portfolios
measurement
media buying
·2 min read
Web-shop LTV with VAT-inclusive prices versus store net proceeds (labelled synthetic)
measurement
media buying
·1 min read
View-through attribution windows on F2P rewarded and interstitial traffic
More from the Measurement desk
measurement
·2 min read
Airbridge adds Amazon Ads as an app measurement channel
measurement
·2 min read
When to freeze a cohort for payback review (and when not to)
measurement
·1 min read
Web-shop purchaser quality vs store IAP purchaser quality
measurement
·1 min read