Stress-test retargeting CPA against an incremental-outcome assumption
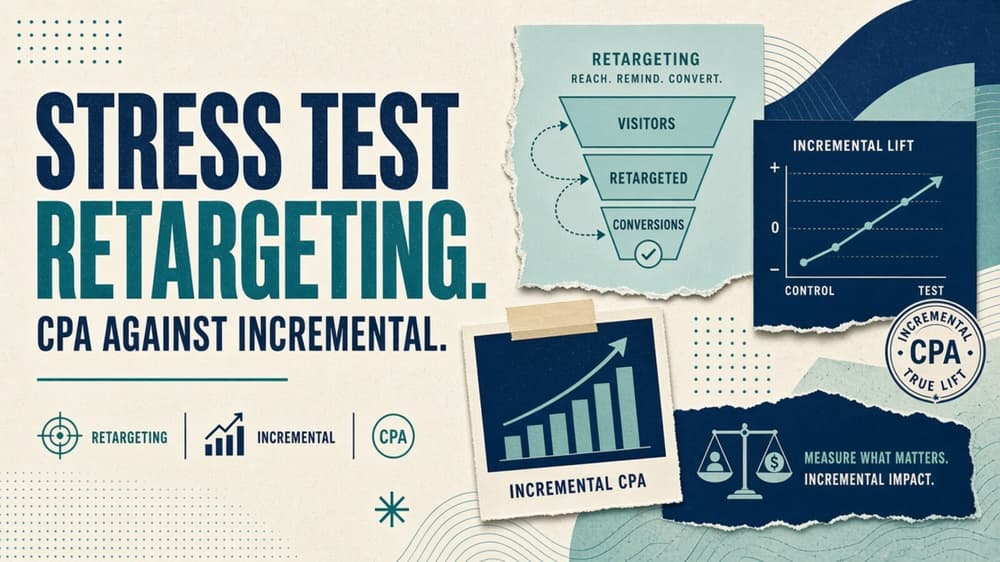
A retargeting campaign may claim outcomes some players would have produced anyway. A reproducible illustrative example with editable inputs and explicit limits.
A retargeting campaign may claim outcomes some players would have produced anyway. This worksheet asks how cost changes when only a specified fraction is additional. It is a sensitivity exercise pending causal evidence, not a tool for estimating the fraction from attribution totals alone.
Define the calculation before using it
Multiply attributed outcomes by the assumed incremental fraction, then divide spend by that scenario count. Display attributed CPA alongside the result. Label the fraction as hypothetical unless a suitable experiment, population and uncertainty analysis support it. Zero additional outcomes imply no finite incremental CPA, so the calculator rejects a zero fraction.
Work through the synthetic example
At 2,000 spend, 200 attributed outcomes and an assumed 25% incremental fraction, attributed CPA is ten while scenario incremental CPA is forty. The result explains how a cheap attribution claim can have much weaker incremental economics. It does not establish that the assumed fraction applies to any real campaign.
| Output | Worked-example result |
|---|---|
| Attributed CPA | 10.0000 |
| Scenario incremental outcomes | 50.0000 |
| Scenario incremental CPA | 40.0000 |
Use the artifact and preserve its assumptions
Open the editable calculator to change the inputs and inspect the sensitivity view. The CSV records synthetic inputs and expected outputs; the JSON fixture keeps the equations available for reproduction. These calculations have been checked against the stated example. No measured campaign data is included.
The sensitivity rows vary only incremental by 20% below and above the entered value. They are scenarios, not confidence limits or a forecast distribution. A row outside the model’s constraints is labelled rather than turned into a plausible-looking result. Save the chosen inputs with the decision so another reader can distinguish a changed assumption from a changed formula.
Evidence and limits
Google describes conversion lag as a reason recent CPA and ROAS can change. The worksheet’s scenario assumptions are supplied by the reader, not generated or endorsed by Google’s forecast system. See About conversion lag reporting, especially “How it works; Campaign types eligible for conversion lag reporting”.
Sampling uncertainty, spillover and interactions with other channels are excluded. A fraction borrowed from another audience or period is not validated by this calculation.
Background: Geo-lift tests: a practical guide for UA teams and Incrementality tests you can afford: geo holdouts, ghost ads, and what breaks. These existing articles provide context; the present calculation does not verify every archived claim.