CPP experiment: conversion lift vs downstream payer quality
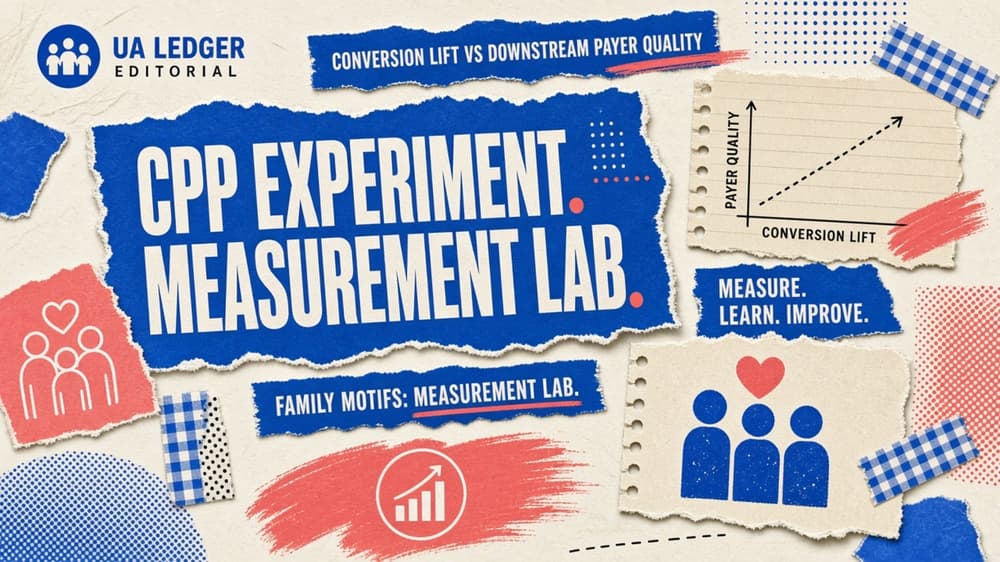
Illustrative lab comparing store conversion lift on a custom product page against downstream payer rate using Apple-documented CPP analytics fields.
Apple’s custom product pages documentation states operators can compare product-page impressions, downloads, redownloads and conversion rates in App Analytics, and can also view retention and average proceeds per paying user for each CPP versus the default page. That is the official definition set this lab uses. It does not publish an industry CVR or payer-rate average.
Define the calculation (illustrative)
Inputs (illustrative example, not a measured campaign):
impressions_default,downloads_defaultimpressions_cpp,downloads_cpppayers_default,payers_cppamong those download cohorts- Optional:
proceeds_default,proceeds_cpp(average proceeds per paying user × payers)
Definitions:
cvr = downloads / impressionspayer_rate = payers / downloadscvr_lift = cvr_cpp / cvr_default - 1payer_lift = payer_rate_cpp / payer_rate_default - 1
A page can win conversion and still lose payer quality. Do not retire the default page on CVR alone if payer_lift is negative and proceeds fall.
Worked synthetic example
| Series | Impressions | Downloads | CVR | Payers | Payer rate |
|---|---|---|---|---|---|
| Default | 100000 | 4000 | 0.0400 | 200 | 0.0500 |
| CPP (genre hook) | 100000 | 5200 | 0.0520 | 208 | 0.0400 |
CVR lift = +30%. Payer-rate lift = −20%. Absolute payers rise only slightly (200 → 208). If average proceeds per paying user also fall, contribution can decline despite the CVR win.
Evidence and limits
Apple documents that App Analytics can show retention and average proceeds per paying user by CPP. This lab does not claim those fields equal MMP ROAS. Product page optimization is a separate traffic-split test (up to three treatments, up to 90 days) and is not a substitute for CPP↔paid creative message match. No live account was inspected.