A rise in paid-install share does not measure incremental demand
Analysis
By Isaac Turner, Measurement Editor — 2 min read
View author profile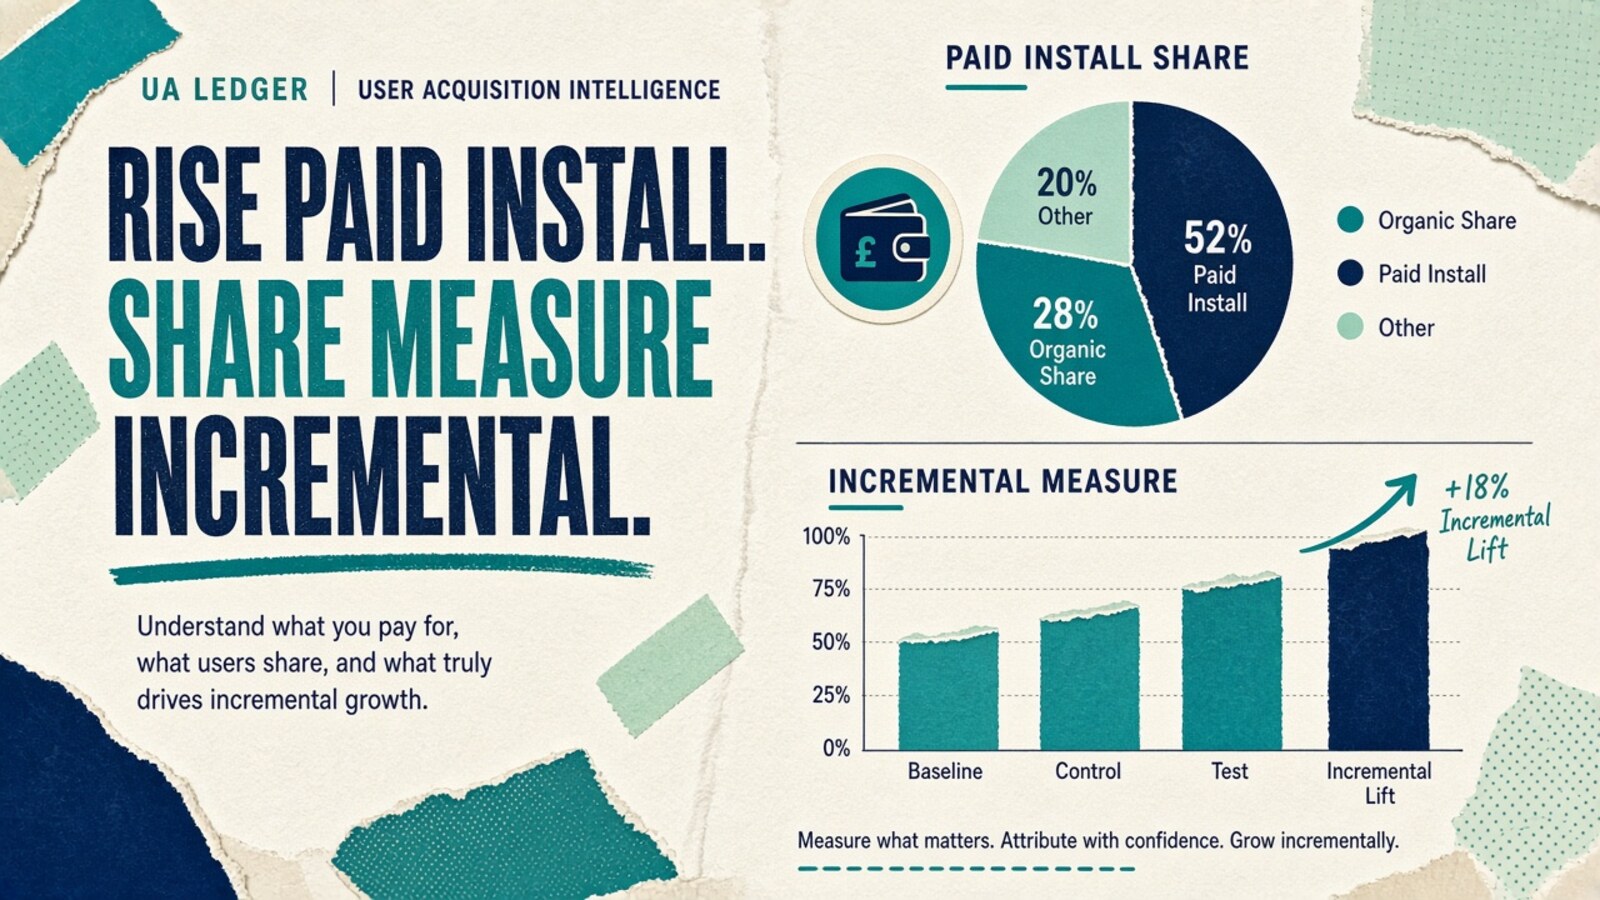
The denominator matters before a share-change claim becomes a budget recommendation.
AppsFlyer reports a 10% year-on-year rise in paid-install share. The wording describes a share change; it should not be silently rewritten as ten percentage points. Source and methodology.
Keep attributed share apart from causality
A paid-install share can change because paid installs increase, organic installs fall, attribution rules change, or the sampled app mix changes. Those are analytical possibilities, not claims that any one of them explains this report. The public summary alone does not identify the contribution of each mechanism.
Our recommendation is to display both the numerator and denominator in an internal comparison. Preserve the definition of paid, treatment of reinstalls and relevant attribution settings. A ratio can appear stable while both underlying counts move substantially, or change sharply while the absolute paid count barely moves.
Ask a narrower budget question
The full report’s public introduction establishes a gaming study, not an experiment in switching paid media on and off. The observed share therefore cannot by itself tell a studio how many additional players its next pound of spend will create.
A better use is to investigate dependence: how much of your observed install flow is currently assigned to paid channels, and how sensitive is the business to that flow? Use a separately designed incrementality study for the causal question. The evidence card leaves the missing weighting and baseline fields visible instead of converting a headline into a universal paid-to-organic target.
Inspect the evidence
Download the source-population and comparability card. The extraction separates documented facts from our analysis and unknowns.
| Field | Evidence or limit |
|---|---|
| Report / publisher | State of Gaming for Marketers 2026 — release and methodology / AppsFlyer |
| Period | 2025 |
| Population | 9,600 gaming apps; 24.8 billion installs, including 14.1 billion paid |
| Metric under review | Reported 10% year-on-year increase in paid install share |
| Aggregation | Vendor aggregate; detailed weighting unknown |
| Critical limit | The public release does not provide the matched-panel weighting or the starting share needed to interpret the reported change fully. |
| Comparable with | A studio series with consistent attribution and an explicit total-install denominator |
| Not comparable with | An unmatched game, period, metric definition or acquisition mix |
Further reading in the existing archive: Attribution is an allocation rule, not a truth; How to Read AppsFlyer's Annual Gaming Benchmarks Report. These links provide background; this check does not independently verify their full contents.
Featured
Related posts
market intelligence
measurement
·1 min read
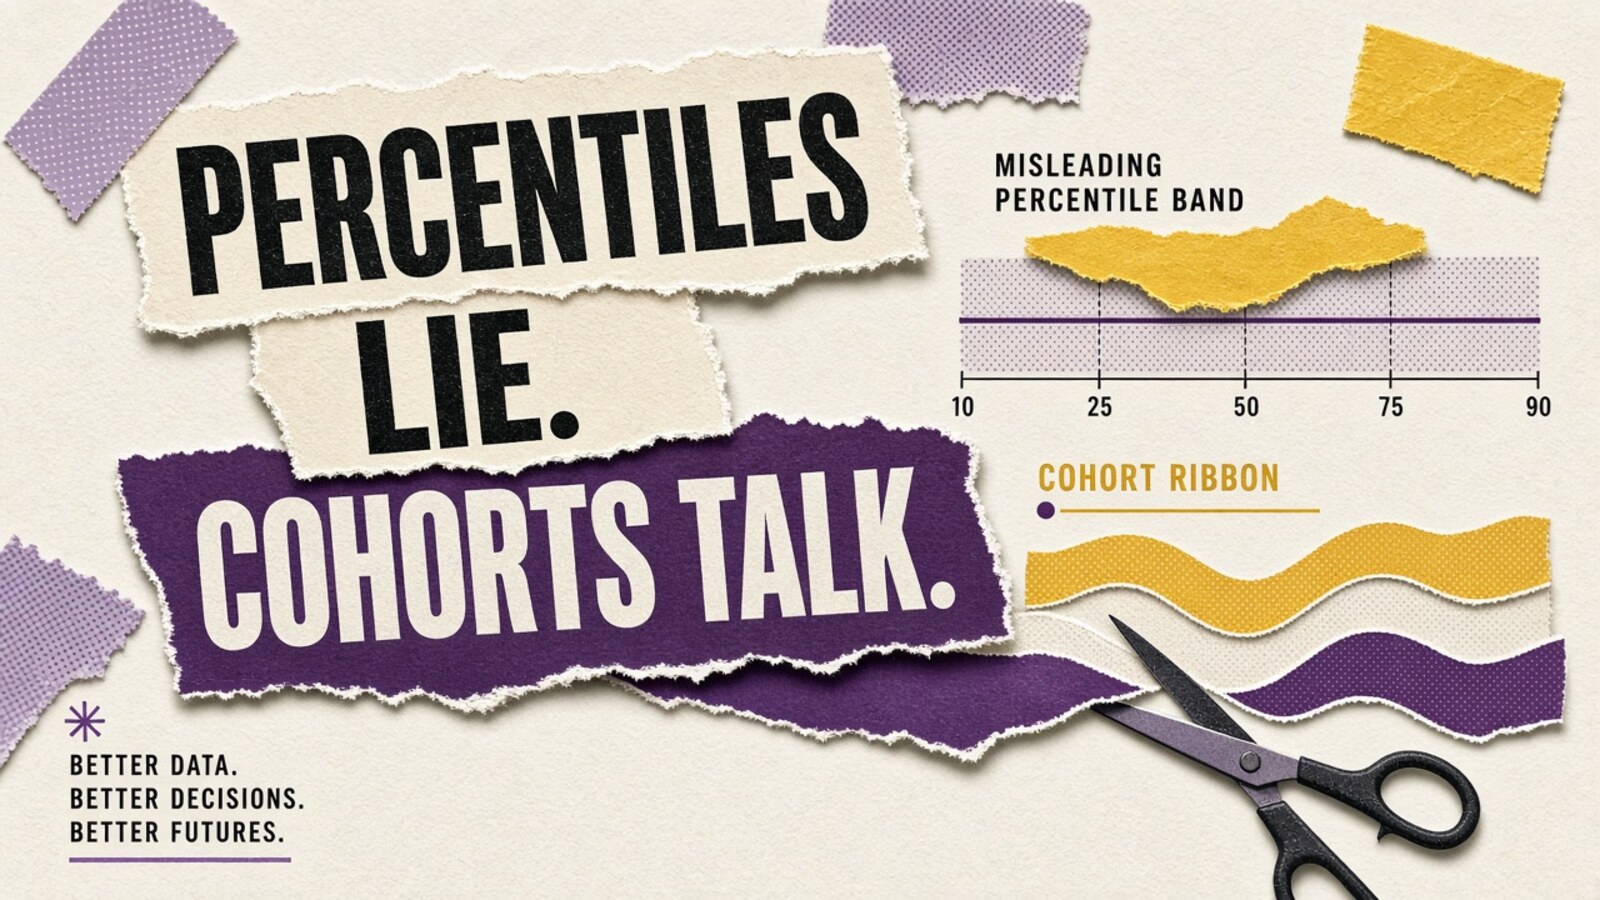
Retention percentile charts for F2P: what GameAnalytics-style cuts miss
market intelligence
measurement
·2 min read
Sensor Tower’s $82 billion figure is an IAP measure
market intelligence
measurement
·2 min read
The 52 billion download headline crosses platforms
market intelligence
measurement
·2 min read
One casual-gaming report contains several data populations
More from the Market Intelligence desk

market intelligence
media buying
·1 min read
Lunar New Year UA gates from an official calendar, not a CPI myth
market intelligence
media buying
·2 min read
WeChat Mini Games upgrades 2026 IAP / virtual-payment incentives for debut titles
market intelligence
media buying
·2 min read
WeChat Mini Games IAA incentives from 20 August 2026: 3-minute lifetime, 180-day option
creative strategy
market intelligence
·1 min read